TryHackMe - Dead End?

TryHackMe’s Dead End? presents a forensic challenge that combines memory and disk analysis. Although it’s marked as hard, the real difficulty came from balancing persistence with efficiency. At times it felt less like a structured investigation and more like solving a puzzle. I spent considerable time working through Task 2 before realizing that brute-force searching wasn’t sustainable, and pivoted to external write-ups to validate my approach. Based on the few community write-ups, I suspect this was a common experience for others as well. Djalil Ayed’s video walkthrough here was very relatable and validated my own frustration.
Even so, I was able to work through key investigative steps: identifying suspicious binaries through Volatility’s cmdline and pstree modules, tracing parent-child relationships, and correlating these findings with artifacts on disk using FTK Imager and registry analysis. By tying the memory evidence to files like part2.txt and connector.ps1 on disk, I could reconstruct the adversary’s activity and piece together the challenge’s flag.
Questions
Task 1 Question 1: What binary gives the most apparent sign of suspicious activity in the given memory image? Use the full path of the artefact.
I first had to refamiliarize myself with Volatility, as it’s probably been at least 1.5 years since I’ve completed any Volatility-related TryHackMe learning rooms or challenges. I began with reviewing command-line and process data, knowing I may need to parse a significant number of individual lines.
It can take a while for Volatility to do its job; be patient.
1
python3 /home/ubuntu/Desktop/volatility3/vol.py -f "memdump.mem" windows.pslist

I wasn’t initially discovering too much out of the ordinary and started trying other modules/plugins. It can still take a while for each Volatility run to complete. I then thought about how I tend to include command-line information immediately within my SIEM investigations both in professional and learning environments.
1
python3 /home/ubuntu/Desktop/volatility3/vol.py -f "memdump.mem" windows.cmdline
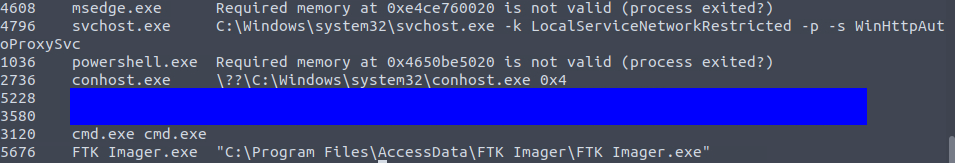
One executable toward the end stood out because it was executed from C:\Tools\ rather than its standard Windows system path, and the command-line arguments indicated an external network connection.
Task 1 Question 2: The answer above shares the same parent process with another binary that references a .txt file - what is the full path of this .txt file?
I noted that svchost.exe (PID 5228) and notepad.exe (PID 3580) shared the same parent process, powershell.exe (PID 1036). This confirmed that the reverse shell activity was likely executed through PowerShell, with notepad serving as a benign sibling process to obscure the malicious activity.
1
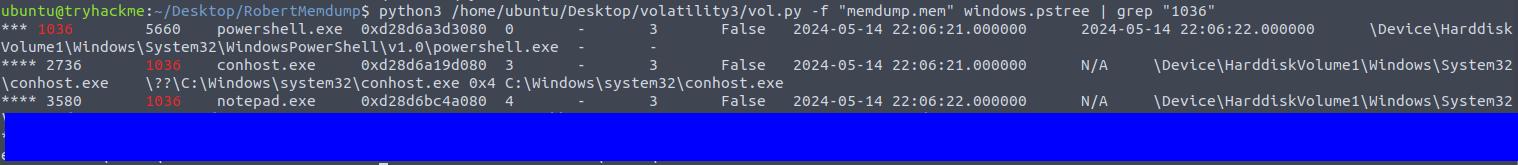
python3 /home/ubuntu/Desktop/volatility3/vol.py -f "memdump.mem" windows.pstree | grep "1036"
From grepping the process tree output, I identified the full path of this .txt file. This file will become an important reference for correlating memory artifacts with disk evidence in the next section.
Task 2 Question 1: What binary gives the most apparent sign of suspicious activity in the given disk image? Use the full path of the artefact.
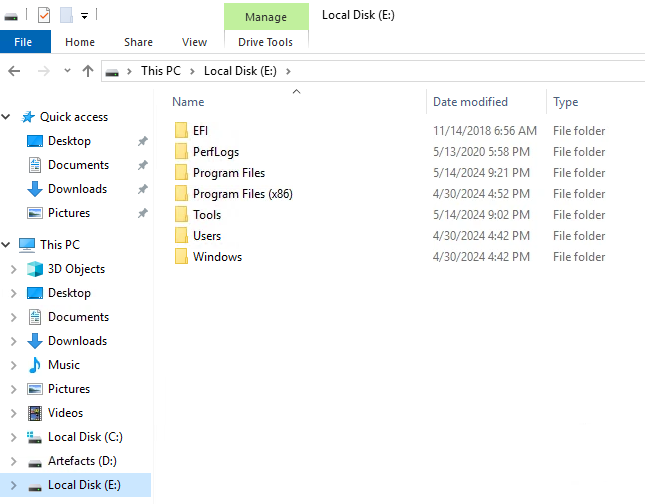
For disk-based artifacts, I mounted robert.dd using FTK Imager and started by inspecting recently modified folders (May 2024).
Initially, nothing obvious emerged. I pivoted to Bobby’s user directory, focusing on the Documents\tmp folder where I found connector.ps1, which relates to a hint given for one of the previous questions. Opening it in a text editor confirmed some of the commands observed in memory. This folder also contained the answer to Task 2 Question 3.
Task 2 Question 2: What is the full registry path where the existence of the binary above is confirmed?
At this point, I stalled significantly. I exported some registry hives and attempted keyword searches (Autoconnector.exe, connector.ps1), but I wasn’t seeing meaningful results. In hindsight, this was partly because I wasn’t confident which hives to load and missed key ones.
I leaned on other investigators’ write-ups, which showed that BAM (Background Activity Moderator) registry keys can confirm process execution. Their solution pointed me to the correct SYSTEM hive along with the right information from BAM. The key takeaway for me is that BAM entries log per-user process execution, and in the future I need to be systematic about extracting all hives before digging too deep in any single one.
Task 2 Question 3:What is the content of “Part2”?
We already found this from one of the previous questions. It’s clearly here so that you try looking for the first part.
Task 2 Question 4: What is the flag?
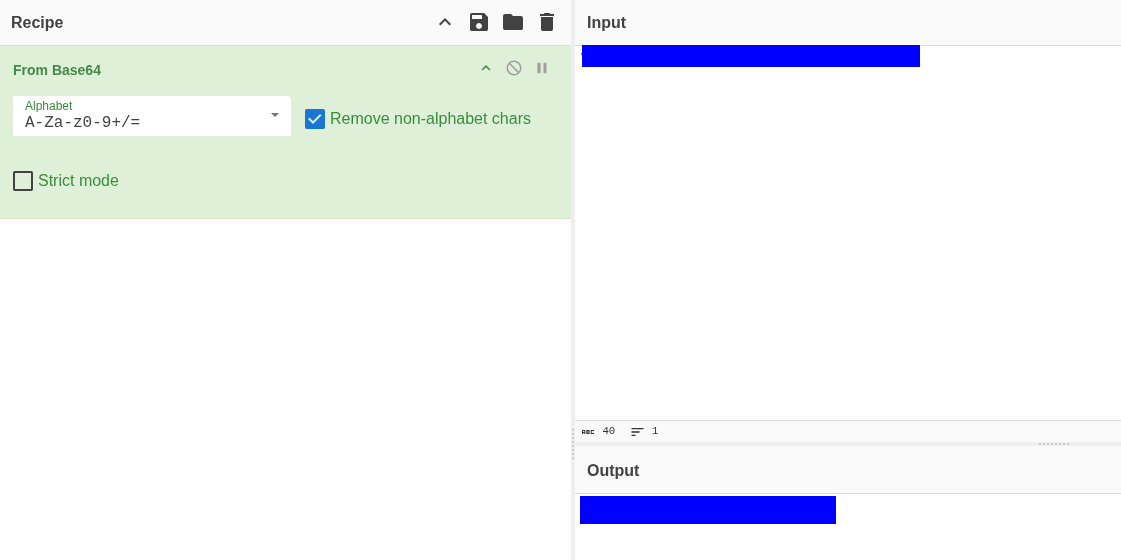
I didn’t recover the full flag independently. Others combined Part2 (from the disk) with another fragment (Part1) identified in PowerShell logs, then decoded it from base64 to get the flag.
The big learning point for me is how fragmented evidence can be: part from disk, part from logs, and the need to think in terms of multiple evidence sources converging.
Conclusion
This challenge underscored a common frustration with TryHackMe labs: knowing the tools doesn’t always make the investigation meaningful. Task 1 allowed me to work methodically with memory artifacts and identify anomalies, but Task 2 felt more like a scavenger hunt than a forensic exercise. I had to rely heavily on other write-ups to answer registry and flag questions, which highlights how some rooms prioritize “finding the flag” over practicing genuine investigative reasoning.
Despite this, the lab did reinforce systematic artifact extraction and cross-referencing memory and disk evidence. It’s a reminder that real forensic work is rarely linear, but some exercises feel artificially convoluted, prioritizing tedious searching over analytical skill. I think I’ll start looking at other platforms again for a bit of variety.